By Joe Selmont, CICOES
Each year, the ocean and atmosphere exchange billions of tons of carbon dioxide (CO₂). This process is one of the planet’s most powerful natural balancing acts — and it’s not happening uniformly over time or across the world.
In a new international study including researchers from the University of Washington and NOAA, a team of scientists has shown that the Pacific Ocean is taking up more CO₂ than ever before, and that this uptake is increasing over time.
The study is part of a larger effort called RECCAP2, an international collaboration coordinated through the Global Carbon Project. One of RECCAP2’s goals is to “take stock” of carbon in the ocean. This is an ambitious task that requires synchronizing observations, models, and expertise from many countries.
For the Pacific Ocean, this meant assembling decades of measurements and modeling results to understand not just how much carbon the Pacific absorbs, but how that uptake is changing over space and time. According to the study, between 1985 and 2018, the Pacific absorbed, on average, about 2.6 billion tons more carbon per year than it did in pre-industrial times. And the annual rate of uptake has been growing steadily each decade — by about 0.1 billion tons per year.
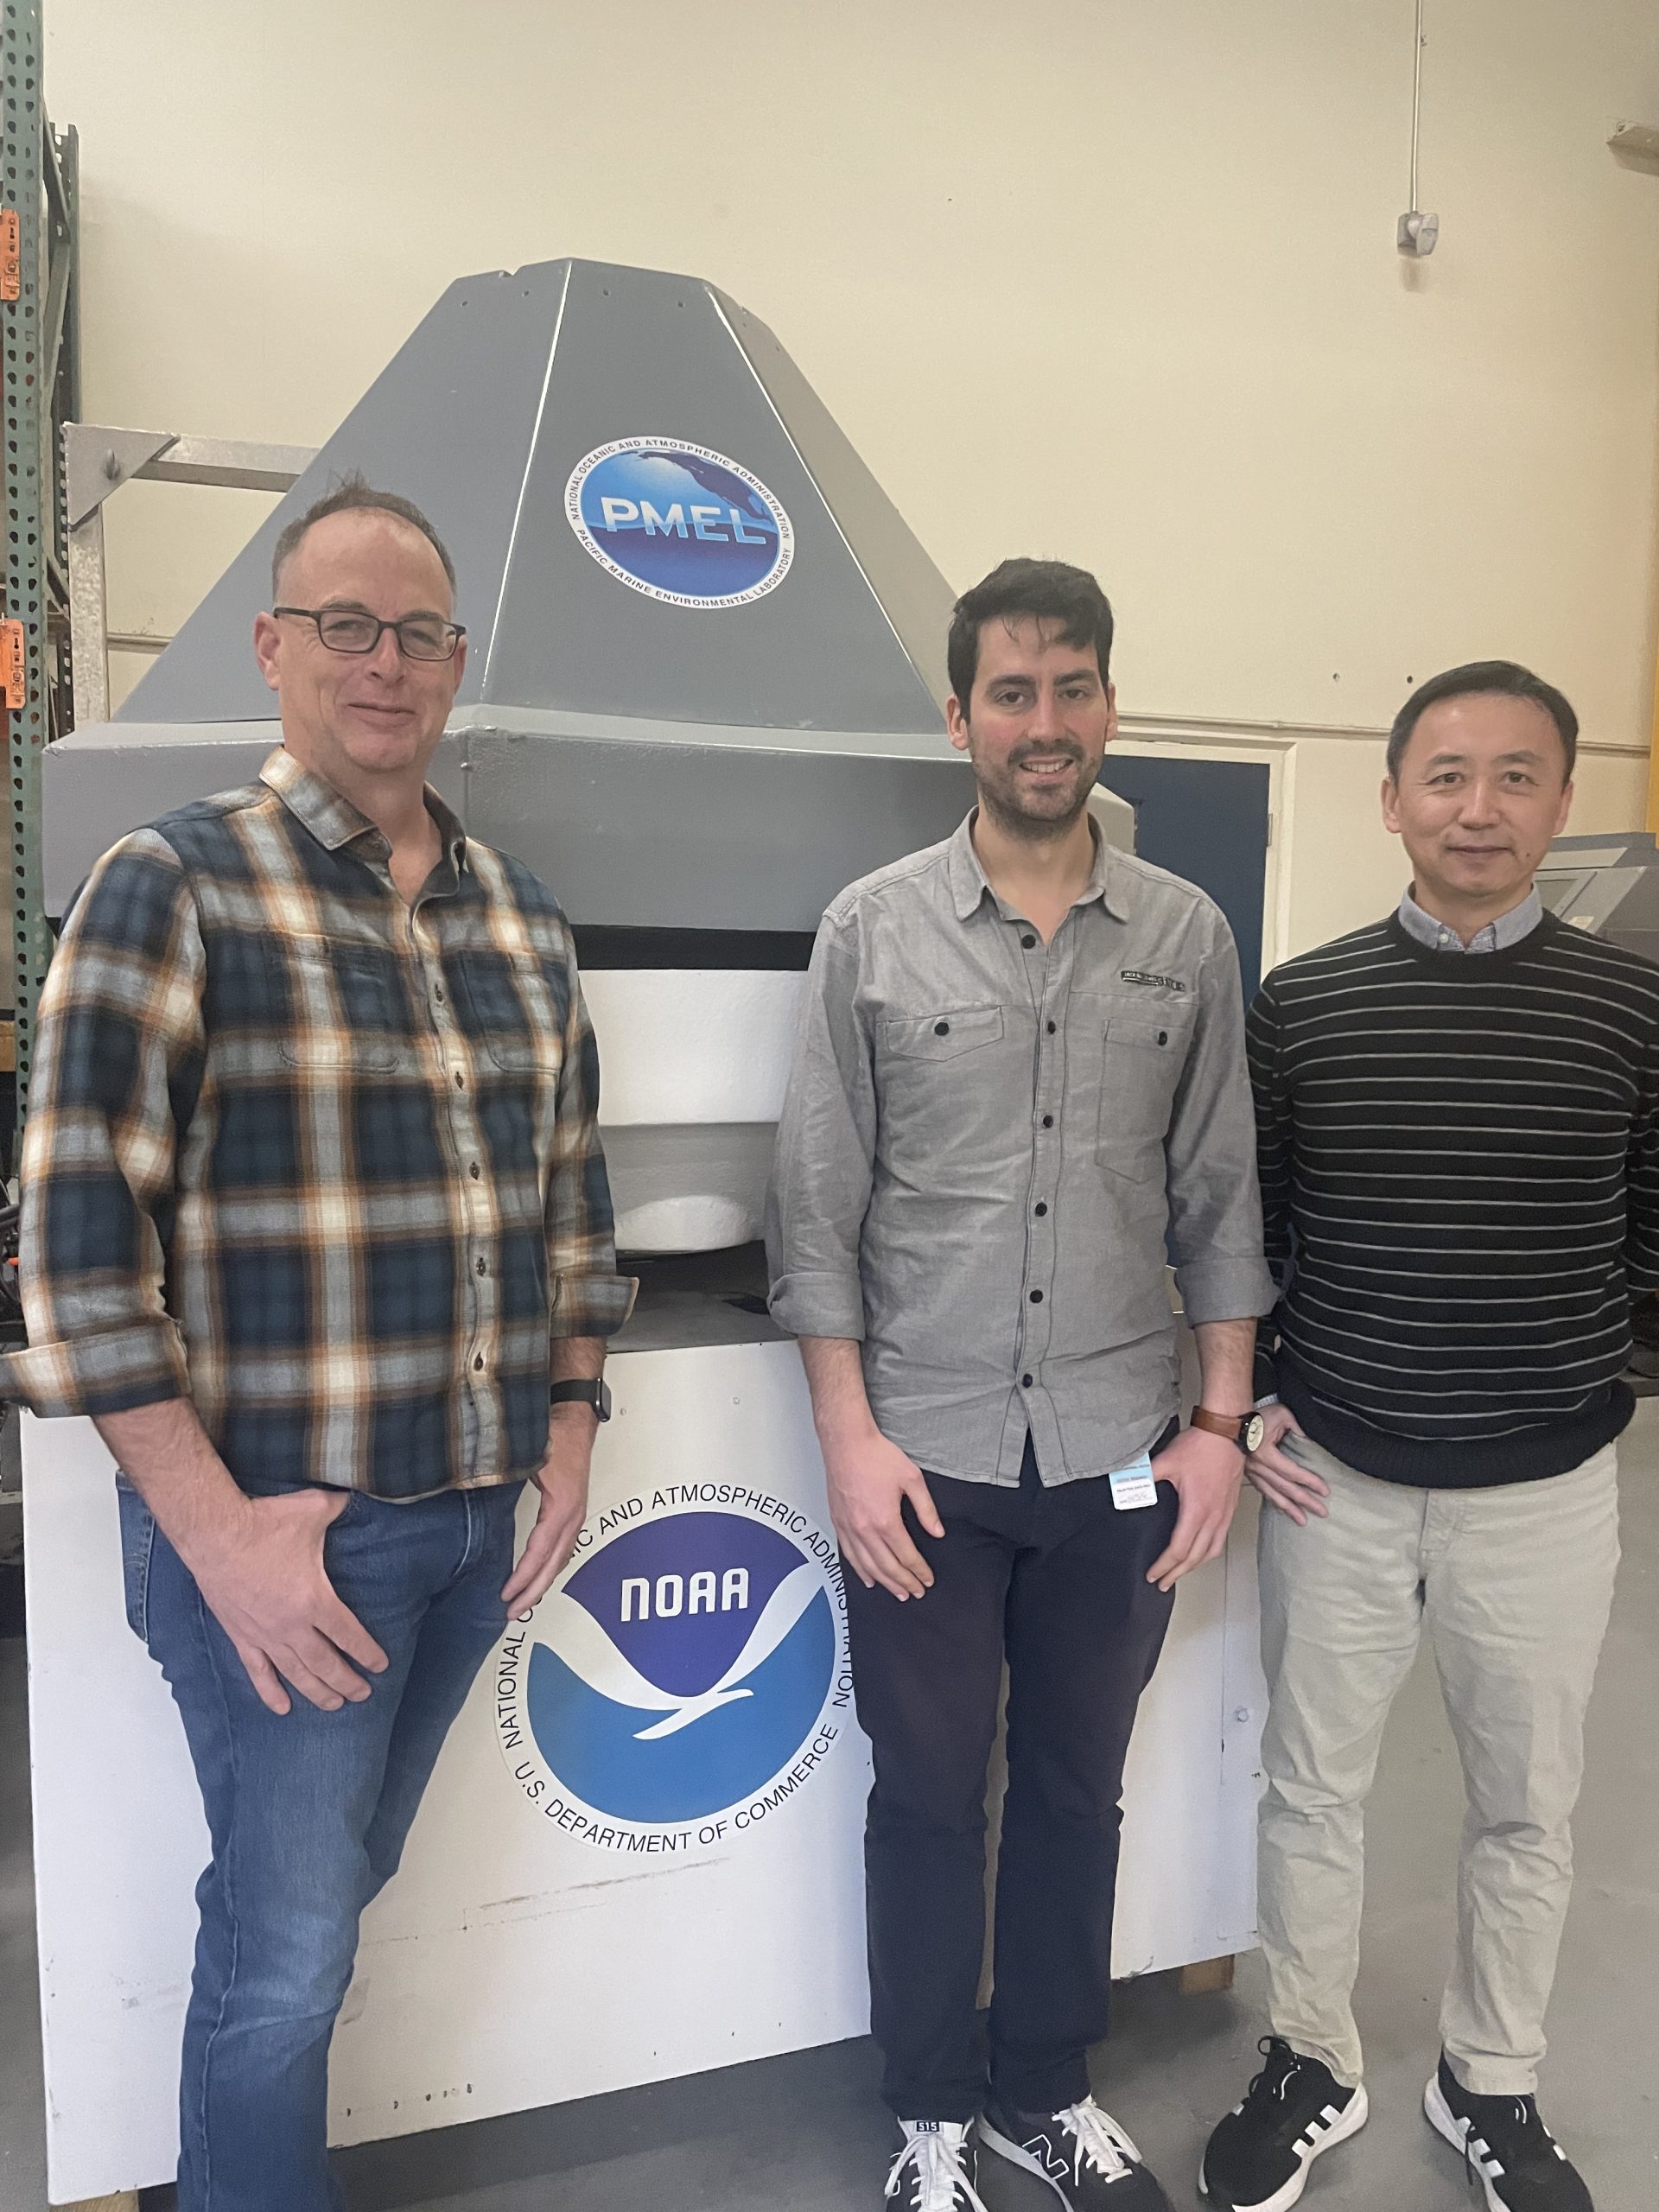
“This is a comprehensive synthesis of a lot of collaborative research on the Pacific Ocean over the last several decades,” said Brendan Carter, an oceanographer at the UW’s Cooperative Institute for Climate, Ocean, and Ecosystem Studies. “Across the world, scientists are taking on the challenging task of tracking ocean carbon dioxide uptake from a lot of different angles.”
Carter worked alongside Richard Feely, a senior scientist at NOAA’s Pacific Marine Environmental Laboratory, and other collaborators from the U.S., Europe, and Japan. Together, they compared results derived from several methods: observational data from research cruises, autonomous vehicles, and moored sensors, as well as outputs from many different models — sophisticated simulations that aim to represent ocean physics and chemistry from first principles.
Both approaches have strengths and limitations.
Observational data and estimates, Carter explained, are grounded in the real world and require fewer assumptions. But the vast majority of the ocean is not being measured at any given time, so estimation techniques are still needed to fill in the gaps.
Models, on the other hand, can simulate every part of the ocean at every moment — including future conditions. In theory, this eliminates blind spots. In practice, however, a model’s accuracy depends on the assumptions it is built upon. And while those assumptions are grounded in historical data, the ocean and atmosphere form an especially complex system, inevitably introducing some unpredictability.
This underscores why the research team used a wide variety of methods.
Carter said, “By using both observations and models — and multiple kinds of models — we can compare results and learn where our approaches agree, and where the uncertainties still lie.”
One key finding from this comparison is that despite occasional differences, the methods tended to converge upon similar results in many regions. That gives researchers growing confidence in their estimates, and allows them to track trends over time.
And in the Pacific, the trend is clear: CO₂ uptake is increasing. But Carter, Feely, and the rest of their team wanted to determine what is driving this increase.
“The southern Pacific is one of the largest CO₂ sinks on Earth,” said Feely. “But we also see a huge amount of variability across the Pacific — especially in the equatorial Pacific, which is strongly affected by El Niño events.”
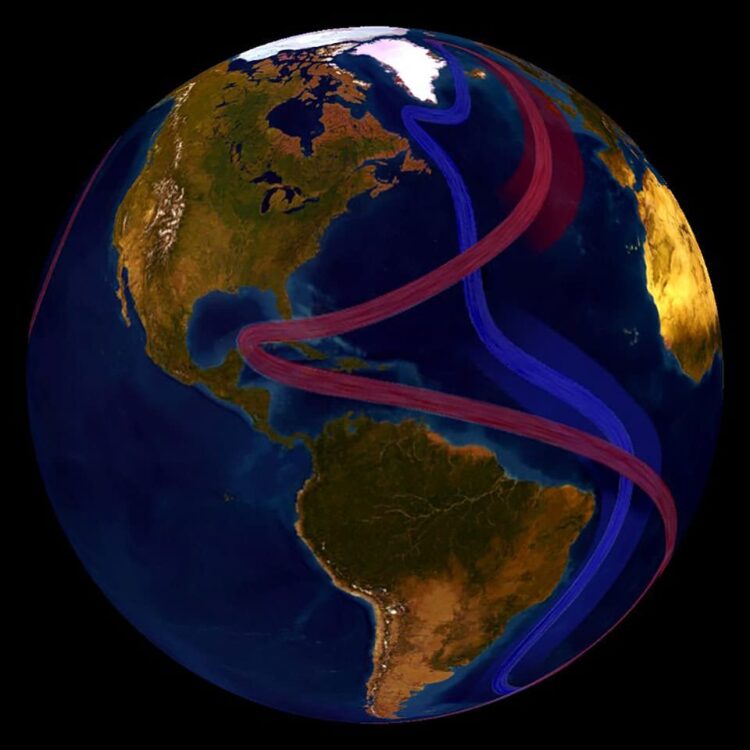
During El Niño years, warm water spreads across the equator, reducing upwelling — the process by which deep, carbon-rich and nutrient-rich water rises to the surface. Once at the surface, this upwelled water exchanges carbon with the atmosphere, often for the first time in decades or centuries. It releases old “natural” carbon accumulated by the decomposition of plants and animals over the years, but also picks up some of the carbon that humans have added to the atmosphere over that same timespan. However, the upwelled nutrients support the growth of marine life near the surface, which enables the ocean to take back some of the natural carbon.
“That dance of carbon — the interplay between natural and anthropogenic sources, upwelling, and biology — that is what we’re trying to understand and quantify,” Carter said.
Despite year-to-year and regional variability, the team’s analysis shows a consistent increase in CO₂ uptake across the Pacific over recent decades. In one sense, that’s good news: the ocean continues to perform a vital role in moderating the amount of carbon in the atmosphere.
But Carter and Feely also expressed caution. There are concerns related to ocean acidification: as more carbon enters the ocean, it initiates a series of chemical reactions that increase acidity. This may have consequences for all kinds of marine life and ecosystems — and the humans who rely upon them. Plus, chemical principles suggest that as more CO₂ is absorbed, the ocean’s ability to take up additional carbon may eventually slow down.
“We’re trying to get the best data we can,” said Carter. “That way, the methods we use to project future scenarios will be as accurate as possible.”
This research reinforces the necessity of both global collaboration and methodological diversity. The strength of the conclusions, Carter emphasized, come not from one model or one dataset, but from combining many.
“By having so many groups, each with their own tools and expertise, we’re able to create a fuller picture,” he said. “With big questions like this, it’s important that we work together.”