Ángel F. Adames Corraliza, a former JISAO/CICOES intern and an alumnus of the Atmospheric Sciences PhD program at the University of Washington, has been announced as a 2025 recipient of a MacArthur Foundation Fellowship. Known colloquially as the MacArthur “Genius” Award, the Fellowship is an $800,000, no-strings-attached award to extraordinarily talented and creative individuals as an investment in their potential.
About his work
Now an associate professor at the University of Wisconsin, Adames is an atmospheric scientist investigating the mechanisms underlying tropical weather patterns. Adames combines deep knowledge of the physics of atmospheric waves with keen analysis of observational data and climate model simulations. He sheds light on tropical atmospheric dynamics that influence global weather patterns and phenomena such as tropical cyclones and monsoons.
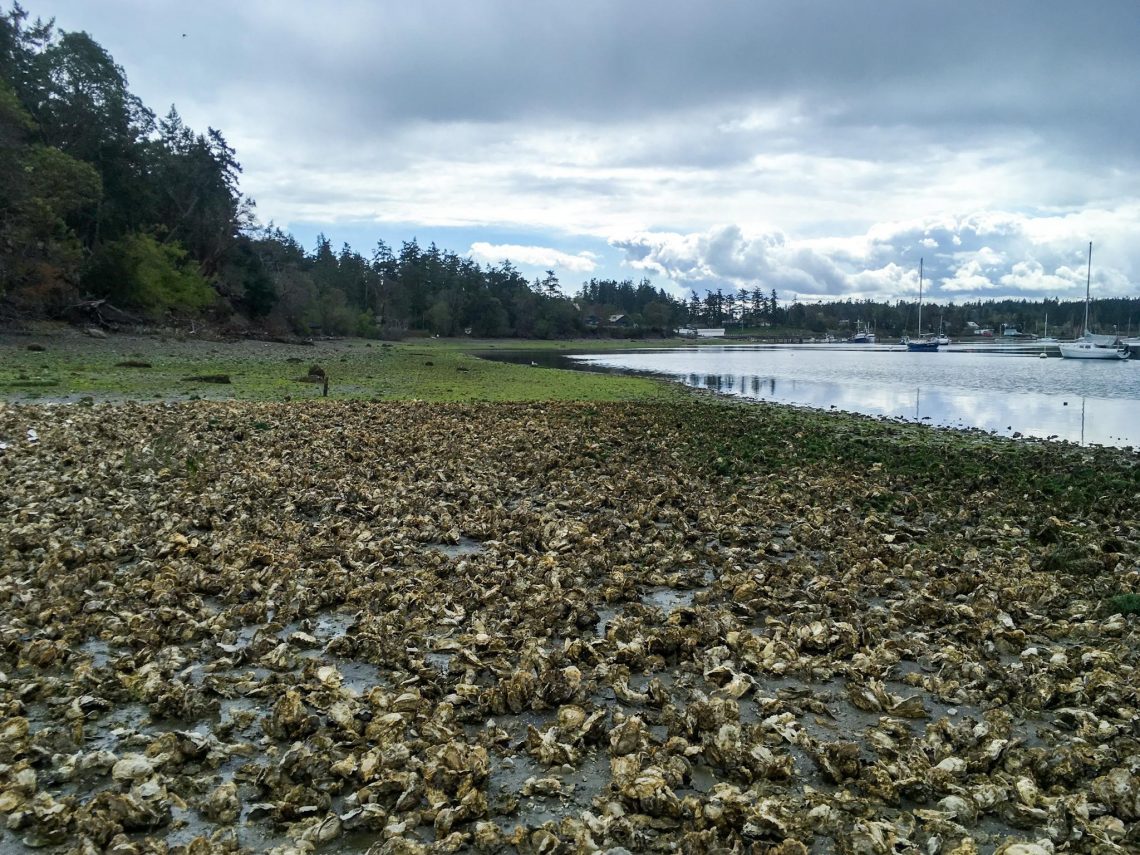
Puget Sound is celebrated for its salmon runs, Dungeness crab harvests, and oyster farms. But beneath the surface, the Sound’s changing waters may pose a threat to this abundant ecosystem.
Because of its geography and the way ocean currents bring in carbon-rich water from the Pacific, Puget Sound is vulnerable to ocean acidification – the chemical process by which carbon dioxide from the atmosphere enters seawater and decreases the pH level. Research shows that the Sound’s waters naturally have higher acidity than the open ocean. This means that additional CO2 can create difficult conditions for species that people in the Pacific Northwest depend on for food, income, and cultural practices.
To help communities respond, the University of Washington’s Cooperative Institute for Climate, Ocean, and Ecosystem Studies (CICOES) has announced a new project funded by the Puget Sound Partnership. The project team will build a data-based tool called Puget Sound Acidification and Impacts (PSAI). The tool will provide accessible, location-specific information on acidification across the Sound, supporting the needs of fisheries, marine resource managers, tribes, and other communities.
An oyster bed during low tide at Mystery Bay State Park on Marrowstone Island in Puget Sound. Photo credit: Julietta Martinelli/University of Washington
Having better information on acidification is more than an academic exercise. Shellfish harvesters need to know whether larvae will survive in local waters. Fisheries managers need to understand how changing chemistry might affect salmon or Dungeness crab. Tribal leaders and state officials are tasked with protecting resources that support both cultural traditions and economic stability.
This is why the PSAI research team will convene an advisory panel of marine resource users and managers. This aspect of the project builds on a long history of collaboration among scientists and community partners from across the region, as exemplified by prior and ongoing work by the Washington Ocean Acidification Center (WOAC), whose co-director Jan Newton is a collaborator on the PSAI project.
By drawing on the expertise of people who live and work on the Puget Sound, the team aims for PSAI to meet real-world needs.
“Engagement with local experts is critical for this project,” said Larissa Dias, a CICOES postdoctoral scholar who is helping to lead the PSAI project. “Our goal is to co-design a functional tool tailored to the needs of resource managers, the people who translate the scientific information into action. To do that, we’re tapping the expertise and perspectives of people who directly support fisheries and other management activities in the Sound. It’s great that several members of our advisory panel have partnered with WOAC in the past, so they already have experience with these sorts of collaborations.”
Panel members will use their extensive knowledge of and experience with local systems to provide guidance on what information would be most useful, what regions or species should be prioritized, and how best to present the data in a way that makes sense to non-researchers. The project team will then incorporate that feedback into the final design of PSAI. The goal is to create not just a technical tool, but a shared resource that will assist with decision-making in the region.
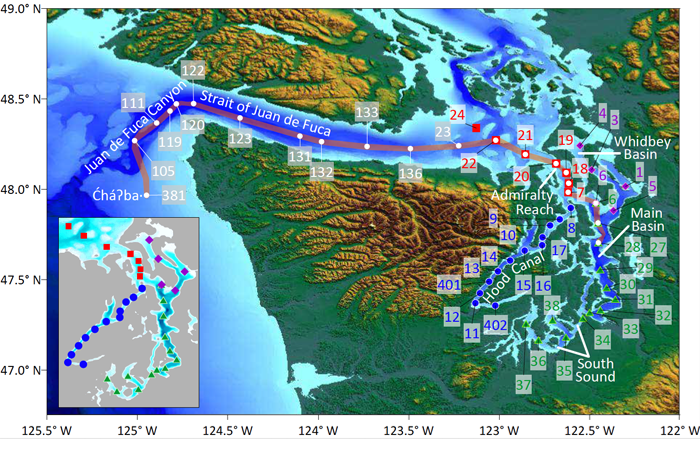
PSAI will draw on existing scientific data from the National Oceanic and Atmospheric Administration (NOAA) and WOAC, adapting years of ocean monitoring efforts into a user-friendly format. Data from more than 61 research cruises and 7,500 samples collected across the Salish Sea since 2008 – known as the Salish Cruise data package – will form the backbone of the tool. These samples include detailed measurements of temperature, salinity, nutrients, oxygen, and carbonate chemistry. Additional data from other sources, such as the Washington State Department of Ecology, will supplement the Salish Cruise data package.
“The Salish Cruise time series provides invaluable long-term observations on changing oceanographic conditions in the Salish Sea. Together with research on biological impacts of ocean acidification performed by the Washington Ocean Acidification Center, the data are now being used to develop decision support tools and information for managers, fishers, and others who rely on our rich marine resources,” said Simone Alin, who is a supervisory oceanographer at NOAA’s Pacific Marine Environmental Laboratory, as well as a founding research partner at WOAC and a collaborator on the PSAI project.
One challenge of assessing the impacts of ocean acidification in dynamic estuarine regions like Puget Sound is that conditions vary dramatically in both space and time, with many processes influencing the water’s chemical composition. A single cruise captures short-term snapshots of conditions at sampling stations, but models and other data analysis approaches can help fill in gaps.
To that end, the project team will apply a combination of machine learning and interpolation techniques to develop algorithms that provide accurate and timely acidity estimates for locations across Puget Sound. In other words, the researchers will build a simple yet robust artificial intelligence tool using proven methods that allow computers to recognize patterns in the data that would be nearly impossible for a human to detect, such as subtle relationships among temperature, salinity, and acidity.
“Machine learning has emerged in recent years as an effective tool in oceanography, especially for filling gaps in scattered datasets of carbonate chemistry parameters that relate to ocean acidification,” said Jonathan Sharp, a research scientist at CICOES and the leader of the PSAI project. “As an example, some recent work I led involves the use of machine learning models to quantify the progression of ocean acidification indicators in large marine ecosystems in the U.S. We found significant changes to indicators like pH and calcium carbonate saturation state, but also significant variability across space and time.”
The end result of the PSAI project will be a user-friendly interface where managers and the public can input a location, depth, and date to see estimates of acidity and related values, along with information about uncertainty. This means that users will have a way to generate on-demand, localized insights into ocean conditions, even when there are no research vessels cruising the Sound.
The project officially begins in December 2025 and will continue through May 2027. In its final phase, following the development of PSAI, the project team will host a series of workshops to introduce the tool to potential users and train them on how to apply it. Eventually, PSAI could also help validate existing ocean models, support long-term planning, and guide targeted mitigation efforts in the future.
When all is said and done, the tool will have two versions: one designed for managers and the public, and another with more detailed options for researchers.
“Local resource managers need accessible information on how acidification might affect the Sound,” Dias said. “PSAI will help provide this information, and in a way that is guided by the local managers’ needs. Ultimately, we want this tool to be useful. The science has to be accessible to the people who need it.”
—
The Puget Sound Acidification and Impacts team consists of researchers from the University of Washington and NOAA, including lead principal investigator Jonathan Sharp (UW CICOES), researcher Larissa Dias (UW CICOES), collaborator Simone Alin (NOAA PMEL), collaborator Jan Newton (UW WOAC), and collaborator Brendan Carter (UW CICOES).
The PSAI project is supported by funding from the Puget Sound Partnership, the Washington state agency leading the region’s collective effort to restore and protect Puget Sound.
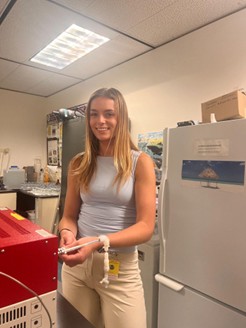
Hi! I am a rising senior at the University of Washington in the School of Oceanography. This summer, I have been working with CICOES PIs Pamela Barrett and Joseph Resing on quantifying methane in seawater to understand Southern Ocean hydrothermal activity and potential trace metal sources.
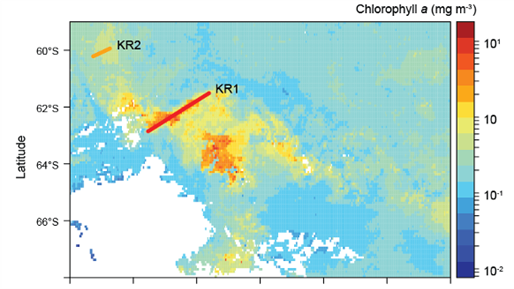
The Southern Ocean (SO) is the most significant high-nutrient, low-chlorophyll region in the world. It is now known that iron, a vital trace metal for phytoplankton growth, is the limiting factor for productivity in this region. Despite the SO’s iron limitations, waters over the Australian-Antarctic Ridge (AAR) features a large annual phytoplankton bloom that has been observed by satellite for nearly 25 years. Although the bloom has varied in size, its location has been persistent, indicating a potential geological iron source.
A chlorophyll map illustrating the KR1 and KR2 ridge sites and the extent of the bloom from November 2013-February 2014. (Schine et al. 2021)
This site is downstream of two known hydrothermally active ridge sites, KR1 and KR2, which have been hypothesized to supply iron to the water column, fueling the annual bloom. Departing in December 2024, the “Bloom Raiders” cruise traversed the bloom region during its maximum in austral summer. The cruise surveyed the area before and during a probable active volcanic eruption, yielding a unique sample set for analysis.
Quantifying methane samples with the gas chromatograph. The seawater is first injected with 20 mL of helium gas and equilibrated for 30 minutes. 20 mL more of helium is injected and mixed before a sample is taken and sent through the gas chromatograph’s copper column and then burned off at a known time, creating a measurable peak.
My analysis thus far has focused on quantifying dissolved methane gas in seawater. As a product of hydrothermal activity, methane and its relatively long residence time can be used as a tracer for plume activity and evolution throughout an eruptive event. We quantified methane using gas chromatography and found significantly higher concentrations in the suspected eruptive region than are typically found in the SO. Preliminary analysis indicates elevated concentrations of methane entering the upper water column. The SO’s frigid waters and steep isopycnals allow these hydrothermal products to progress into the euphotic zone. If the activity is frequent, the venting could be a consistent source of trace metals to the phytoplankton bloom.
These methane results will later be compiled and compared with data for other tracers of hydrothermal activity, including Fe and Mn concentrations, oxidation-reduction potential, and 3He. The cohesion of these results will provide insight into the biogeochemistry of the area, and specifically, which nutrients are supplied by hydrothermal vents and are distinct from background or other advected sources.
Understanding the sources, evolutions, and quantities of trace metals is vital for the prediction of future blooms and carbon drawdown. Key species, including humpback whales, rely on the AAR bloom as a feeding ground, with some of the region overlapping with Marine Protected Areas. With developments in technologies for iron-fertilized marine carbon dioxide removal and deep-sea mining, this region is incredibly important for continued research.
A specialized plane, camera and a crew of four are in Alaska to understand the ecosystems of the Bering and Chukchi seas.
Jiaxu Zhang is a research scientist at the University of Washington, and for the last four summers she’s brought a team of researchers to Nome for the Arctic Airborne Investigations and Research project, or Arctic AIR for short.
“Arctic AIR does all sorts of research, ranging from physical oceanography to sea ice surveys to phytoplankton studies and remote sensing,” Zhang said. “And sometimes we also onboard some observers to do some marine mammal surveys.”
Carefully enhanced wastewater could one day benefit coastal marine resources
The continual rise of carbon dioxide in the atmosphere isn’t just changing weather patterns, it’s also silently altering the chemistry of the global ocean. As CO2 dissolves into seawater, it forms carbonic acid, driving down ocean pH in a process known as ocean acidification. This fundamental shift threatens marine economies, ecosystems, and organisms from shellfish to coral reefs.
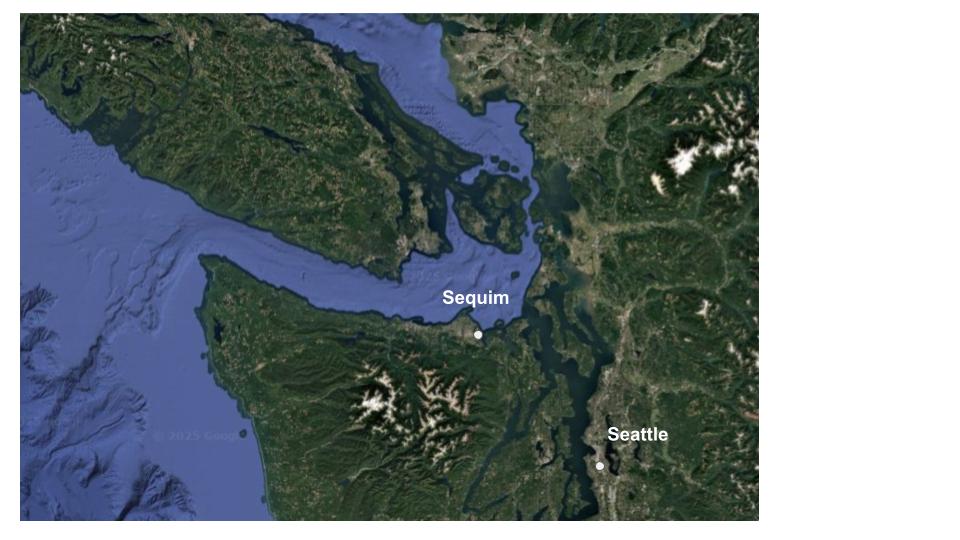
One potential approach for reducing the local effects of ocean acidification is called ocean alkalinity enhancement, which involves shifting the chemistry of ocean water back toward its natural, slightly alkaline (basic) state. Over the past two years, a small-scale research project in Sequim, Washington has explored whether a new electrochemical process could make seawater locally less acidic while enabling it to absorb more carbon dioxide from the atmosphere. The project is part of NOAA’s larger exploration of emerging ocean carbon management technologies, which it is pursuing at the direction of Congress.
The findings of the research team, which included scientists from NOAA’s Pacific Marine Environmental Laboratory and the University of Washington, the Department of Energy’s Pacific Northwest National Laboratory (PNNL), and the company Ebb Carbon, were published in the journal Frontiers in Environmental Engineering.
The ocean alkalinity enhancement experiment took place at the Department of Energy’s Pacific Northwest National Laboratory is located in Sequim, on Washington State’s Olympic Peninsula. Source: Google Maps
“Our project was about implementing the method in a highly-controlled, contained, modeled, and monitored environment,” said Brendan Carter, a scientist with the NOAA-University of Washington Cooperative Institute for Climate, Ocean, and Ecosystem Studies. “Our two federal labs and Ebb Carbon teamed up to ensure that this process was safe and had the expected impacts on the chemistry of seawater when operated on small scales.”
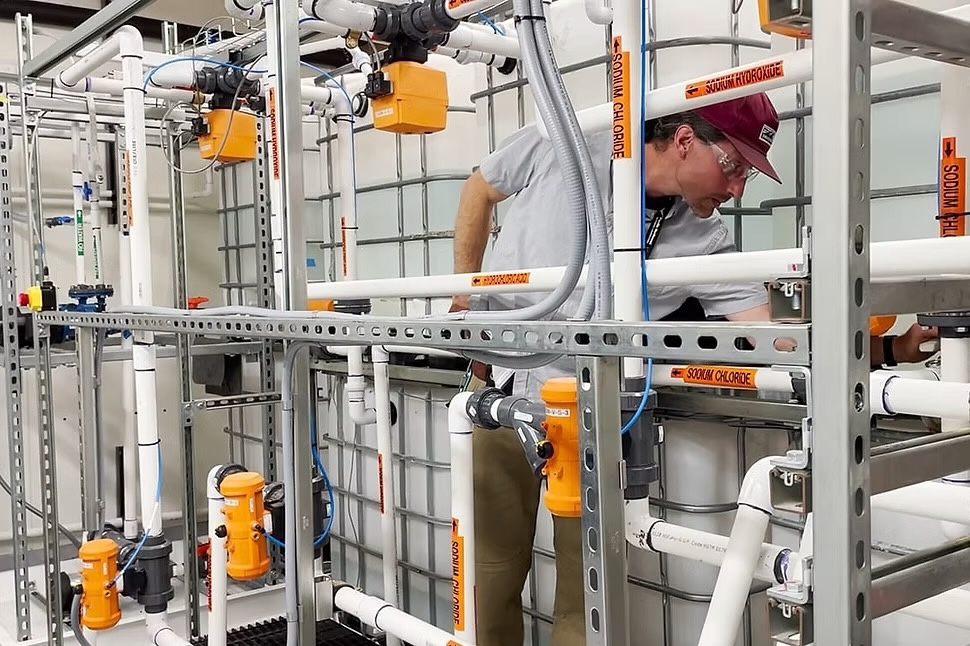
The three-year project involved pumping small amounts of seawater from Washington’s Sequim Bay into PNNL’s Marine and Coastal Research Laboratory. The seawater then entered Ebb’s prototype bipolar membrane electrodialysis system, which passed it through a series of electrically-charged membranes that split seawater into alkaline and acidic streams.
An Ebb Carbon researcher operates the company’s first prototype bipolar membrane electrodialysis system installed at the PNNL-Sequim campus on Washington State’s Olympic Penninsula. Credit: Ebb Carbon
The treated alkaline seawater was held in open-air tanks while scientists measured the partial pressure of carbon dioxide dissolved in the seawater, pH, turbidity, dissolved oxygen, total dissolved inorganic carbon, and total alkalinity. The treated seawater was returned to the ocean through PNNL’s existing wastewater system in accordance with existing permits.
The researchers conducted two experiments, one in November 2024 and the second in February 2025. Their primary objectives were to assess their ability to maintain and monitor the elevated pH (less acidic) within the facility, ensuring it remained below the permitted maximum at the end of the pipe, and to determine if the increased alkalinity could be detected beyond the outfall.
In the November trial, about 7,000 gallons of alkalinity-enhanced seawater was released, roughly the volume carried by a large tanker truck. The February trial involved releasing 47,000 gallons of alkalinity-enhanced seawater — a nearly seven-fold increase in the volume of discharged seawater compared to the November pilot. (For comparison, an Olympic swimming pool holds 660,000 gallons.) Still, the team observed no detectable alterations to the surrounding water’s temperature, salinity, turbidity, or oxygen levels, indicating a minimal immediate environmental impact. They did observe a very localized increase in alkalinity and pH that dissipated within approximately eight feet of the discharge pipe. This rapid dilution highlighted the challenges of detecting small-scale ocean alkalinity enhancement signals in dynamic coastal environments.
This study demonstrates that a conservative small-scale release of electrochemically generated alkalinity-enhanced seawater from a coastal outfall can meet existing environmental permits, and temporarily improve water quality.
Please join us for the CICOES Intern Symposium. This culminating event highlights the hard work and achievements of our 14 CICOES interns, who are all conducting research projects under the guidance of scientific mentors.
The Symposium is on Thursday, August 21st from 10:15am to 12:15pm in Alder Hall Commons. We’ll begin with opening remarks and introductions of each intern, followed by a series of 90-second videos that briefly recap each intern’s project and overall experience. The remainder of the event will be a poster session, creating time for the interns to discuss their work in more detail.
Here are our interns, their mentors, and the working titles of their research projects.
Amanda Blunt – Seattle University
Mentor: Lucia Upchurch
Project: Arctic aerosol trends at the NOAA Barrow Atmospheric Baseline Observatory
Cailey Plainte – Simmons University
Mentor: Will Ballentine
Project: How acidification affects the hydrodynamics of Wing Foot Snails (Pteropoda)
Eliana Gonzalez – Bowdoin College
Mentor: Georgy Manucharyan
Project: The role of localized weaknesses in Kobuk Lake ice breakup patterns
Engi Yang – John Hopkins University
Mentors: Daniel Schindler, Jackie Carter, Chris Boatright
Project: Sockeye salmon ecosystem research in Bristol Bay, Alaska
Erin Novobilsky – Marist College
Mentor: Travis Mellett
Project: The impact of iron bioavailability to phytoplankton and bacteria growth in the North Equatorial Pacific
Project: Saildrone observations of ocean currents and ecosystem variability during the development of the 2023-24 El Niño
Lydell Mitchell – Montana State University
Mentors: Shelley Johnson, Tessa Code, Lisa Wetzel
Project: Influence of artificial light at night (ALAN) on salmon predation
Margaret Veatch – Colby College
Mentors: Daniel Schindler, Jackie Carter, Chris Boatright
Project: Sockeye salmon ecosystem research in Bristol Bay, Alaska
Nico Davis – Colorado College
Mentors: Matt Luongo, Ed Blanchard-Wrigglesworth
Project: Investigating impacts of winds on ocean circulation via a hierarchy of models
Rachel Mutti – University of Miami
Mentors: Sophie Nuber, Maureen Walczac
Project: Reconstructing the ratio of magnesium to calcium from single foraminifera to understand marine heat waves during current and past climate changes
Sirray Smith – Morgan State University
Mentor: TJ Fudge
Project: Small scale variability in Antarctic snowfall and its impact on ice core records
Thomas Do – University of San Francisco
Mentor: Xinyu Li
Project: How seasonality affects the coastal ocean’s CO2 uptake from the atmosphere
Vanessa Martiny – University of Minnesota, Twin Cities
Mentor: Aditya Khuller
Project: Effects of surface roughness and impurities on ice thickness and photosynthesis during Snowball Earth
Zoe Khan – Smith College
Mentor: Eric Ward
Project: Combining survey data to quantify spatiotemporal variation in fish populations across the northeast Pacific Ocean
The magnitude-8.8 earthquake off Russia’s Kamchatka peninsula sent a wave of water racing at the speed of a jetliner toward Hawaii, California and Washington state, spurring warnings and alarm overnight Wednesday.
But when the tsunami waves arrived, they didn’t cause devastation or deaths in the United States, and the inundation might not have appeared threatening in some locations where warnings were issued.
That doesn’t mean the tsunami was a “bust,” that it was poorly forecast or that it didn’t pose a risk, earthquake and tsunami researchers said.
“You start to hear ‘tsunami warning,’ and everyone immediately thinks of the last Hollywood movie they saw, and then it comes in at 3 feet and people are like, ‘What’s that?’” said Harold Tobin, the director of the Pacific Northwest Seismic Network and a professor at the University of Washington. “We should count it as a win that a tsunami occurred, we got a warning and it wasn’t the worst-case scenario.”
Here’s what to know.
How strong was the Kamchatka earthquake? And why did it change so much?
Initial reports from the U.S. Geological Survey pegged the Kamchatka earthquake at magnitude 8.0. Later, it was upgraded to 8.8.
“That is not uncommon for very, very large earthquakes in those initial minutes,” Tobin said. “Our standard algorithms for determining the size of an earthquake quickly saturate. It’s like turning up an amp and getting a lot of distortion.”
One of the first signs the earthquake was stronger than the initial seismic reports said was an initial measurement from a buoy about 275 miles southeast of the Kamchatka peninsula.
The buoy, which is part of the National Oceanographic and Atmospheric Administration’s DART (Deep-ocean Assessment and Reporting of Tsunamis) system, is connected to a seafloor pressure sensor about 4 miles below the surface.
The sensor registered a 90-centimeter wave — more than 35 inches — which is eye-popping to tsunami researchers.
“That’s the second-largest recording we ever saw in the tsunami world,” said Vasily Titov, a senior tsunami modeler at NOAA’s Pacific Marine Environmental Laboratory, adding that it indicated there was “a catastrophic tsunami propagating in the ocean.”
Titov said the only higher reading was from the 2011 Tōhoku earthquake and tsunami, which killed nearly 16,000 people in Japan.
Seismic models later confirmed that Wednesday’s earthquake was magnitude 8.8, which means it released nearly 16 times as much energy as a magnitude-8.0 earthquake, according to a USGS calculation tool.
Tōhoku was much bigger.
Tobin estimated that earthquake released two to three times as much energy as was observed in Kamchatka. Titov said the tsunami in Japan was also about three times larger.
In addition, he said the Tōhoku earthquake “produced an anomalously large seafloor displacement,” lurching and moving more water than expected, even for an earthquake of its magnitude.
At Kamchatka, “it’s likely that there was less seafloor displacement than could have happened in a worst-case or more dire scenario for a magnitude-8.8,” Tobin said, though more research will be needed to confirm that theory.
[…]
Why were people in Hawaii evacuated for a 5-foot wave?
Yong Wei, a tsunami modeler and senior research scientist at the University of Washington and the NOAA Center for Tsunami Research, said a 1.5-meter (5-foot) tsunami wave can be very dangerous, particularly in shallow waters off Hawaii.
Tsunami waves contain far more energy than wind waves, which are far shorter in wavelength and period (time between waves) and slower in speed.
Wei said tsunami waves of the size that struck Hawaii can surge inland “tens of meters,” produce dangerous currents and damage boats and other moveable objects.
“People die. If they stay there and they don’t get any warning, 2 meters can definitely kill people,” Wei said. “If you’re on the beach, strong currents can definitely pull you out into the ocean and people will get drowned.”
Tobin said the initial warnings were conservative but appropriate, in his view.
“I don’t want people to think, oh, we had a warning and nothing much happened and pooh-pooh it — ‘I can ignore it,’” he said. “Warnings by nature have to err a bit on the side of caution.”
Ice forecasts would boost public safety, subsistence fishing, hunting, transportation and commerce
NOAA and the University of Washington have joined with the Native Village of Kotzebue, Alaska, to create a new forecast model that will help predict the spring ice breakup on a major lake outside the village.
Hotham Inlet, known locally as Kobuk Lake, is a 38-mile-long, 19-mile-wide lake that transforms each fall when the ice freezes into a prime place for fishing and a critical travel corridor for people on snowmachines and with dog teams.
The lake is a few miles from Kotzebue, the largest community and the economic and transportation hub in Alaska’s Northwest Arctic Borough. The iced-over lake allows local communities to create an ice road to transport air freight that arrives in Kotzebue to communities around the lake, visit friends and make it easier for people from smaller villages to get to Kotzebue for shopping.
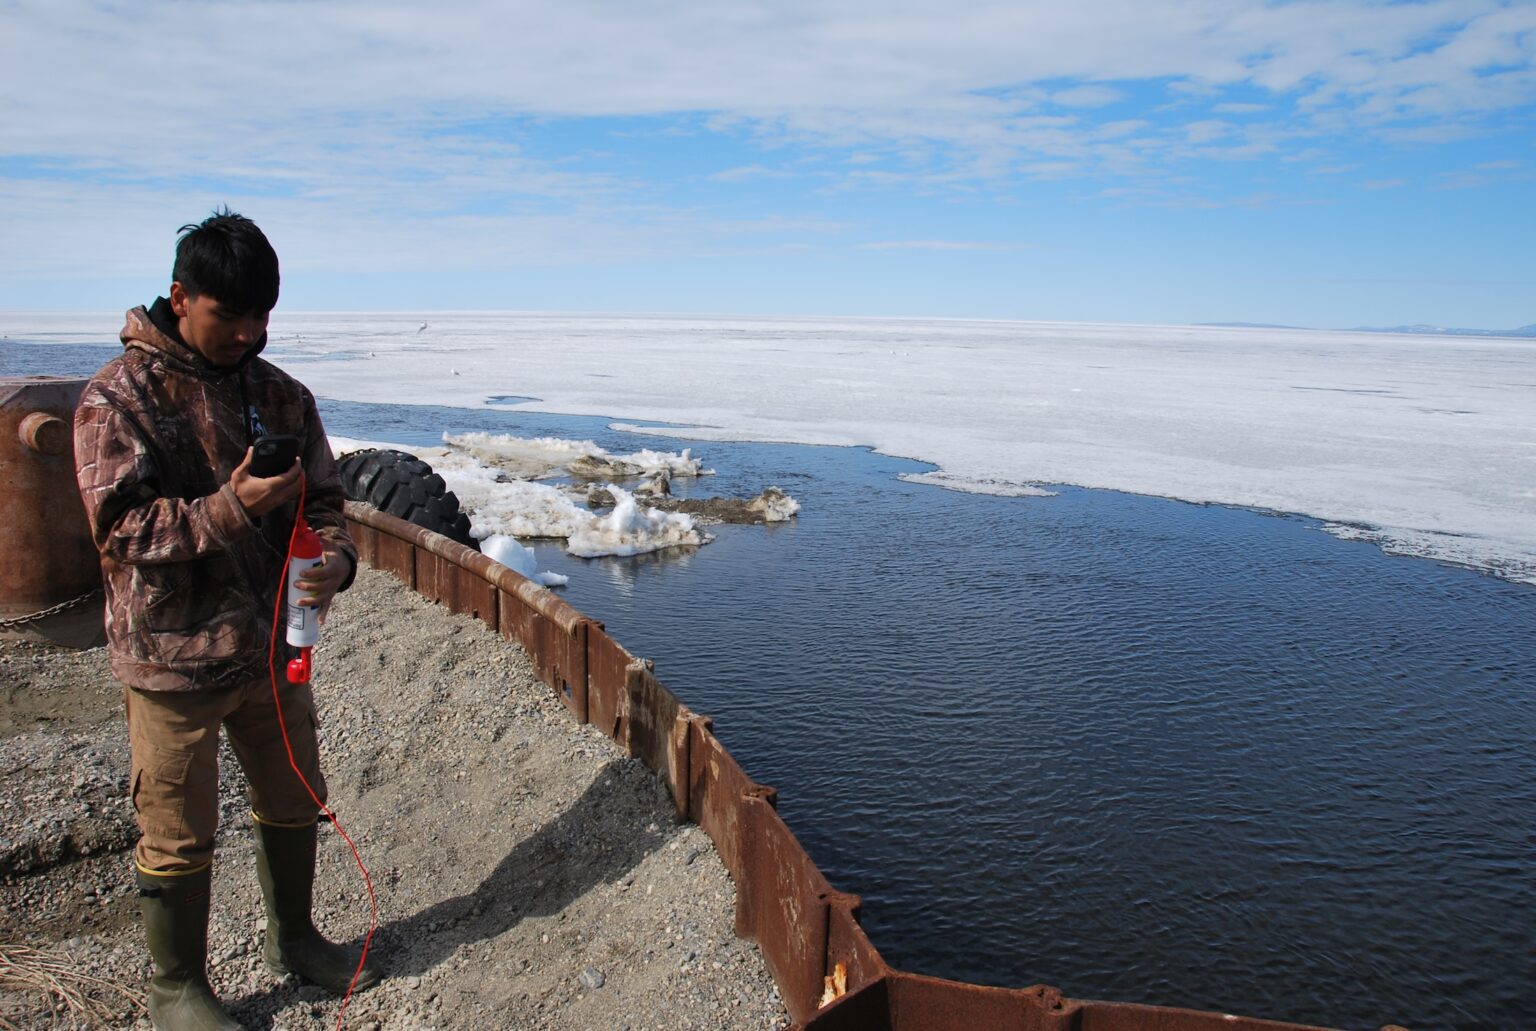
Tyler Kramer, a Kotzebue high school student, monitors the salinity of the water flowing into Kobuk Lake from the Chukchi Sea to assist with research for the ice breakup model. Photo credit: NOAA
While NOAA National Weather Service ice forecasts provide information about ocean and coastal sea ice and ice breakups on major rivers, there are no specialized forecast models for Alaskan lakes, even large ones like Kobuk Lake, which is fed by two rivers and influenced by tidal flow from the Chukchi Sea.
“This new model we are developing is the future of ice prediction,” said Jiaxu Zhang, the project leader who is a research scientist at the UW’s Cooperative Institute for Climate, Ocean and Ecosystem Studies and NOAA’s Pacific Marine Environmental Laboratory in Seattle. “We want to make it useful and relevant to the people who depend on knowing the condition of ice for safe fishing, hunting, transportation and trade. And the best way to do that is to work directly with the people of Kotzebue on it.”
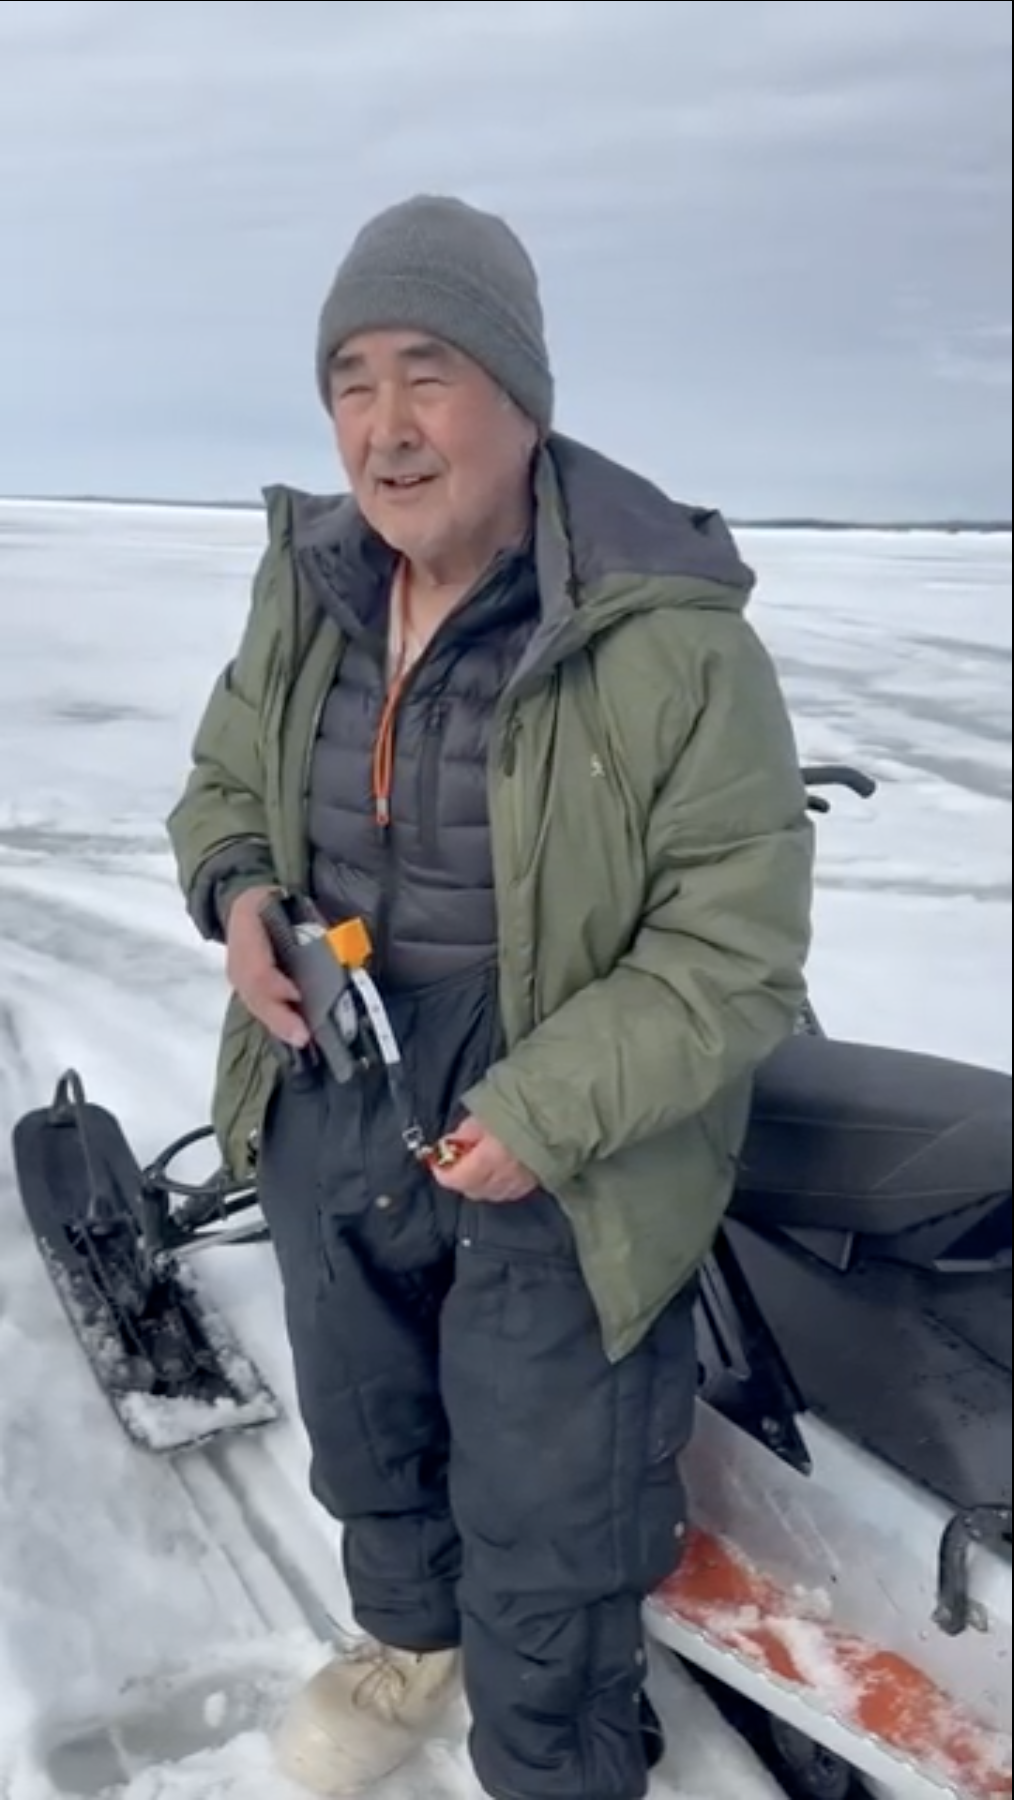
Bobby Schaeffer, an elder from the Native Village of Kotzebue has been helping provide data from the ice on Kobuk lake for the ice breakup model. Schaeffer used a drill and measuring tape to measure ice thickness and a handheld Conductivity, Temperature and Depth sensor to record temperature and salinity in May 2025.. He provided extensive information about the natural history and many human uses of Kobuk Lake. Credit: NOAA
Unlike traditional ice models that treat ice as one continuous sheet, this new model will simulate how individual ice floes crack, move and pile up — complex processes that are key to predicting exactly when and where Kobuk Lake ice will break up.
For thousands of years, the community has used its Indigenous knowledge and deep understanding of ice to plan their fishing and hunting. But with changing temperatures and weather, this new model which combines physical science with Indigenous knowledge could improve the forecasting of spring breakup for Kotzebue and become a model for other Alaskan and Arctic locations.
The residents of Kotzebue bring valuable knowledge of the ice, the wildlife that inhabit it and the ways they have detected when the breakup is occurring in the past.
Ice fishing provides major source of protein for locals
“Fishing here is really important for us,” said Bobby Schaeffer, an elder from Kotzebue who contributes to the project. For Schaeffer and many of his neighbors, much of their protein comes from subsistence fishing and hunting.
Kobuk Lake is well known for a large whitefish called sheefish that can grow as large as 50 pounds. Community members also fish for herring and a variety of smaller whitefish species. These fish are then frozen, pickled or dried to be consumed throughout the year.
Left to right: Jiaxu Zhang, PMEL and University of Washington, Tyler Kramer, Native Village of Kotzebue, Zheng Liu, University of Washington, Alex Whiting, Native Village of Kotzebue Environmental Program Director. Credit: NOAA
The ice fishing season typically begins in late fall and continues into May. In recent years, the ice in parts of the lake has broken up earlier than it did 20 or more years ago, said Schaeffer. He attributes it to the warming atmosphere, which is affecting not only the ice formation and thickness, but all the fish migration patterns, birds, seals and caribou that depend on the lake’s ecosystem.
Team gathers aerial and on-ice observations for model
To create the model, Zhang and her interdisciplinary team collected observations of the ice before and during breakup, including aerial surveys from a NOAA Twin Otter airplane operated by NOAA Commissioned Corps officers and crew. In May, the aircraft was loaded with sensors to take high-resolution images and LIDAR (Light Detection And Ranging), a remote-sensing method that uses laser light to measure distances and create highly detailed 3D representations of ice thickness, surface roughness, and environmental features.
In addition to the aerial observations, Schaeffer and Alex Whiting, the Native Village of Kotzebue environmental program director, collected observations on the ground and on the ice. Schaeffer measured the thickness of the ice over time by drilling holes in strategic locations on the ice. Tyler Kramer, a Kotzebue high school student, monitored the salinity of the water flowing into the lake from the Chukchi Sea. By understanding how much salt water flows into the lake and how much of the colder fresh water from rivers blocks that salt water flow into the lake, the scientists have key information for the model about how the warmer saltier water accelerates ice melting from below.
The NOAA Twin Otter crew. Left to right: NOAA Corps LT Kyler W. Johnson, NOAA Corps Ensign Kieran Viggiano, Ron Pauley, NOAA Aerospace Engineer Technician, Jiaxu Zhang and Zheng Liu. Credit: NOAA
The Kotzebue community members have also contributed a wealth of information about how the breakup has occurred in past years, areas where it is likely to soften first and areas where ice may support fishing and hunting longer into the spring before it breaks up.
Two interesting focal points of the research are the formation of annual pressure ridges running across the lake and recurring thin ice areas that melt out early in the breakup process. While the location of these open water areas reappear in the same place each year, the position of the associated cracks can change from year to year, according to an analysis of satellite images and the current observations. Understanding the forces that cause these phenomena will help to create a successful and accurate breakup model.
The next step to building a model is to create what’s called a hindcast, a validation technique that involves running historical observations through the model and comparing the accuracy of the output to the actual timing of past ice breakups. From this, the team will create and test a model to predict future ice breakup.
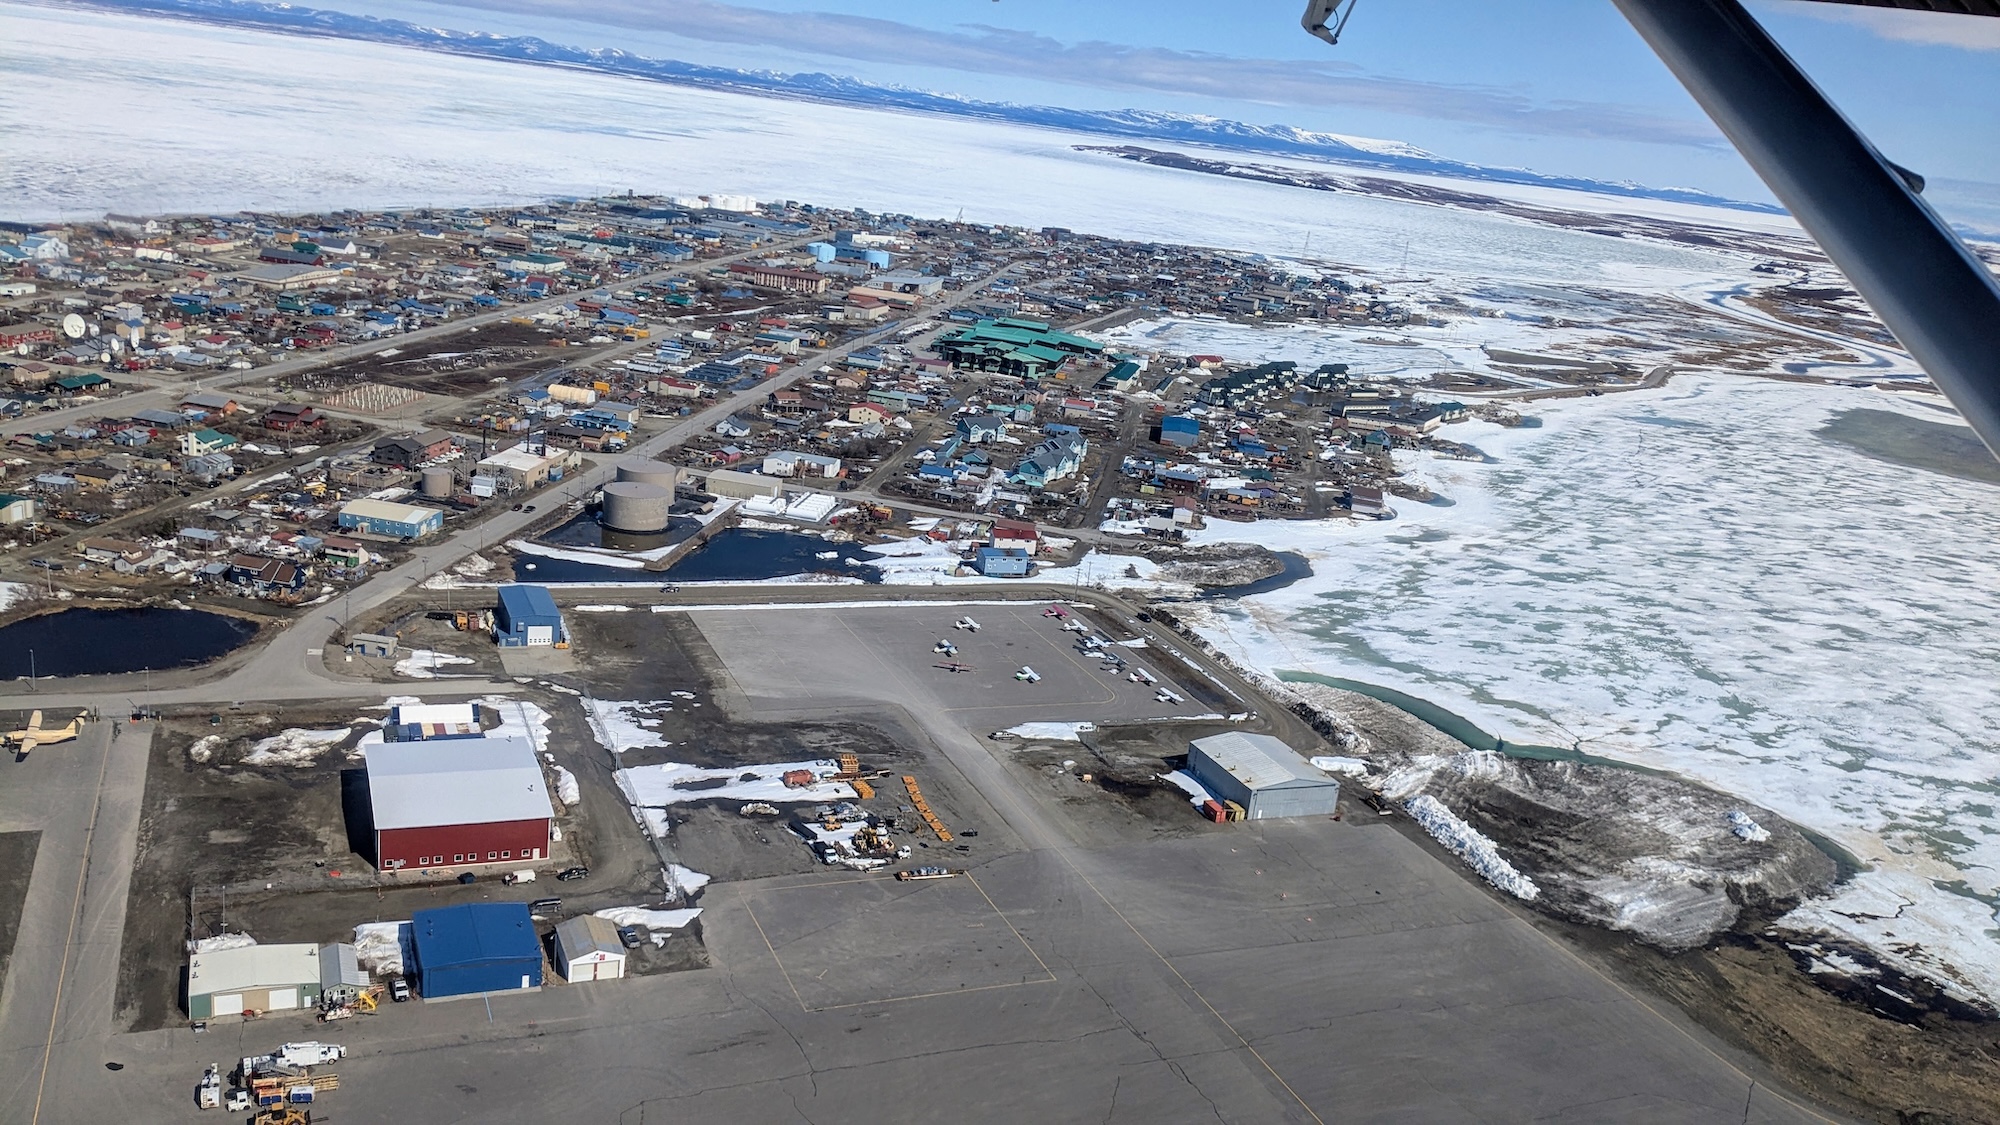
An aerial view of Kotzebue taken from the NOAA Twin Otter aircraft. Kotzebue is the largest community and the economic and transportation hub of Alaska’s Northwest Arctic Borough. Credit: NOAA
During the CICOES All-Hands Meeting on June 24, 2025, researchers from across the CICOES community presented about ongoing projects, recently completed work, or their next big ideas. The presentations were divided into three sessions: Atmospheric-Ocean, Climate, and Ecosystem.
With permission from the researchers, their presentation slides or videos are now available to the public.
The Atlantic Meridional Overturning Circulation, or AMOC, is a system of ocean currents that plays a crucial role in regulating Earth’s climate by transporting heat from the Southern to Northern Hemisphere. Confined to the Atlantic basin, the AMOC modulates regional weather — from mild summers in Europe to monsoon seasons in Africa and India.
Climate models have long predicted that global warming will cause the AMOC to weaken, with some projecting what amounts to a near-collapse relative to the AMOC strength in observations today. But a new study from a team of researchers that included the University of Washington shows that the AMOC is likely to weaken to a much lesser extent than current projections suggest. The study was published May 29 in Nature Geoscience.
A severe weakening would have far-reaching consequences, including changes in regional sea level rise, and major shifts in regional climate, such as colder conditions in northern Europe and drier weather in parts of the Amazon and West Africa.
“Our results imply that, rather than a substantial decline, the AMOC is more likely to experience a limited decline over the 21st century — still some weakening, but less drastic than previous projections suggest,” says David Bonan, lead author of the study and a UW postdoctoral research fellow in the Cooperative Institute for Climate, Ocean and Ecosystem Studies.
The researchers developed a simplified physical model based on fundamental principles of ocean circulation — specifically, how sea water density differences and the depth of the overturning circulation are related — that also incorporates real-world measurements of the ocean current’s strength. The real-world data was collected over 20 years with monitoring arrays and other observations of the Atlantic basin.
Results show that the AMOC will weaken by around 18-43% by the end of the 21st century. While this represents some weakening, it’s not the near-collapse that more extreme climate model projections suggest.